
Making my Academic Network using d3.js
Published:
What is Academic Network
My master’s advisor used to introduced me to his colleagues as his academic son. In my first year of Ph.D., I had an assignment to trace my academic ancestry – to come up with a pedigree like structure that illustrates scientists and scholars according to mentoring relationships, often doctoral mentor–mentee relationships. I assumed an academic genealogy was supposed to be like a phylogenenetic tree (Academic genealogy sounds so misleading, though). But it was obvious that the tree model will fail once the mentorship involves more than a single advisor.
Data collection
I used two sources for data collection. First, I used the Academic Family Tree. This website had a lot of information but also a lot of information that I was particularly looking for was missing. Interestingly, recent information was more likely to be missing compared to the older ones, which probably reflects how the number of doctors increased tremendously in the recent years. In some cases, I used Wikipedia, mainly to confirm what was presented in the Academic Family Tree website when really interesting names appears.
Visualizing data using d3.js
D3 stands for Data-Driven Documents that helps to visualize (preferably) large data using HTML, SVG, and CSS and D3.js is a JavaScript library for that. Browsing through the examples provided, it was pretty obvious that any one of those widgets in either Hierarchies or Networks category would serve the purpose. In fact, there was a widget named Phylogenetic tree which was very tempting to try. But since there will be reticulations, the trees seemed not the optimal solution.
I looked into the options in network category. The force-directed graph seemed pretty similar to what I have seen in Who is Who in Phylogenetic Networks. This could be useful of there are many nodes with multiple incoming and outgoing edges, but the academic network is generally going to be linear. I instead chose Mobile Patent Suits (MPS).
First, the collected data must be formatted in a way that the chosen widget can read. The MPS widget required as .csv file with three columns: 1) source, 2) target, and 3) type. So an arrow would start at the source node and end at target node. Each type will have different colors. This is my final input file.
This input file then replaced what was already uploaded in the example code.
links = d3.csvParse(await FileAttachment("FILENAME.csv").text())
Finally, because the size of the network become much larger than what it originally was, I manually changed the size of the final product.
height = 1700
My Academic Network
You can see my academic network here!
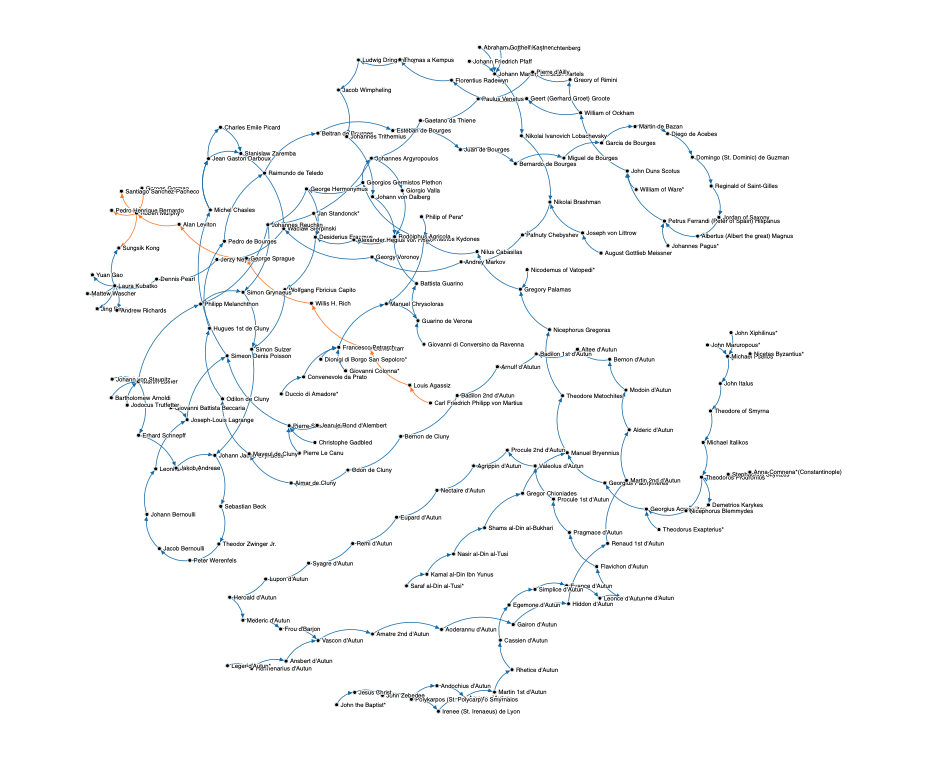
A few notable clusters of vertices I find interesting:
A good portion of the lineage involves those with d’Autun. Autun is a region in central-eastern France. On the eve of persecution of Septimus Severus (Roman Emperor, 193–211), Saint Polycarp, a Christian bishop of Smyrna–an ancient Greek city and Izmir of Turkey today, who is an academic grandson of Jesus Christ and an academic son of John Zebedee, or John the Apostle or Saint John the Beloved, assigned to Saint Irenaeus (a Greek Bishop who expanded Christian communities in contemporary south of France) two priests (one of them being Andochius d’Autun) and a deacon. Under supervision of Saint Irenaeus Second Bishop of Lyon in 190–202 serving as a graduate student and Andochius d’Autun First Priest of Autun in 202–250 as a research scientist, Amatre d’Autun became the First Bishop of Autun in 250–270. He was the beginning of long lineages in d’Autun. This is the first case of reticulation in my academic network.
I also found three names that may be very familiar for phylogeneticists. William of Ockham, one of the major figures of medieval thoughts, who is commonly known for Occam’s razor (or Ockham’s razor or Ocham’s razor). The Occam’s razor represents the principle of parsimony which is the problem solving principle that states “entities should not be multiplied beyond necessity”, sometimes inaccurately paraphrased as “the simplest explanation is usually the best one”. This idea bases the method of maximum parsimony or cladistic parsimony, with which a phylogenetic tree is inferred using the criteria that involves the fewest character state transformation. Nevertheless, this method turns out to be statistically inconsistent regardless of sampling effort in case of, for example, long branch attraction.
Tracing back only a few generations upward, I found the name Andrey Markov, the Russian mathematician whose name is hard to miss in Bayesian phylogenetic tree inference problem. He was a doctoral advisor for Georgy Voronoy, an Ukraine mathematician and a professor in University of Warsaw in Poland, who is known for Voronoi diagram. Voronoy and Stanisław Zaremba, a Polish mathematician and engineer, co-advised Wacław Sierpiński who is known for contributions to set theory, number theory, theory of functions and topology. In University of Warsaw, Sierpiński advised Jerzy Neyman who was the first to describe phylogenetic maximum likelihood methods. Joseph Fersenstein noted: “Theoretical work in Berkeley has been less widely noted. It started with the Jukes-Cantor distance and the stochastic model derived from it. Shortly afterward, Berkeley’s famous statistician Jerzy Neyman became involved, owing to contact with Allan Wilson. He was the first to describe maximum likelihood phylogeny methods for molecular sequence data, a development for which I often mistakenly get the credit.”.